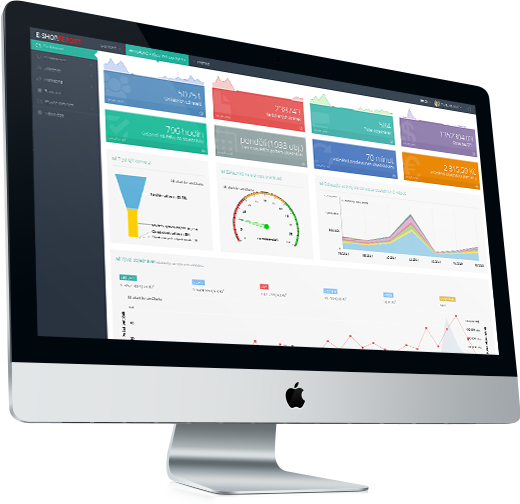
We connect not only the most widely used analytical systems and comparison websites but also collect our own data which we further compare, evaluate and search for correlations and trends among them.
Thanks to the involvement of several e-shops with the same commodity within a market, we can compare how your e-shop performs not only among periods, but also on the particular market.
We know how to collect customer data - basic, such as IP, GeoLocation, browsers, but also advanced - customers purchases not only at your e-shops, but also at other e-shops that are using our system.
Based on past transaction data and past visits, CPA and CPC calculations, retention and other values, we are able to calculate how much revenue your average customer will make and how long the customer will purchase from you.
Based on past transaction data, thanks to complex and sophisticated algorithms, we can predict the future development of your key indicators.
In our application, you can set goals that you want to track - for example turnover per week, month, year – clear dashboard helps to understand how you meet your targets.
Our system collects data which are provided back to you, so that you can customize your e-shop for specific users – special offers, favorite categories, banners, etc.
Thanks to our long-term experience in e-commerce, we are able to offer you help and recommendations’ on what to do if some e-shop indicators are not as good as they could be.
Classic e-commerce dashboards, the one you know from Google Analytics, enriched with information about what happens in your e-shop and whether it is right or wrong, plus recommendations on what needs to be done…all that with an emphasis on turnover and e-shop performance.
Customers divided into segments – New, Sleeping, Rising, Stars, Falling, Caution – furthermore by geolocation, browser, device. You can also get an information about turnover of individual customers in these segments.
You can connect the E-SHOP. REPORT with your accounting system, with your Google Analytics accounts, AdWords, social media and comparison websites. This will provide you with additional, expansive data and gives you a complete picture of your e-shop.
A comparison of many projects involved in the same market segment, can give you an overview of your e-shop performance, whether it is on the top or rather at the bottom of the particular market segment – comparisons not only within the competitive market, but also between selected periods.
Data are the most valuable commodity you have. We collect your data, analyze and sort them before we send them back to your e-shop. By customizing you can reach specific customers with special offers, sort categories by popularity and offer them brands and products they are really interested in.
Based on sophisticated algorithms, we are able to predict the development of your e-shop in the future – by setting your own goals our prediction can be more precise – our reports can then provide you with the information how your e-shop approaches these goals and if it is needed to make some changes.
Once your e-shop reaches an important milestone, you can instantly learn about it from your RSS feed – place, where all important information are sent. You can also set up intervals in which you wish to receive your manager reviews.
Since we love large and well-arranged dashboards and nothing can make us more happier that the sound alert of a new order and growing profit, we have decided to please your senses...please enjoy our selected statistics on dashboard that change in real time. They illustrate what is going on on your e-shop right now!
Chcem to proste skúsiť s jedným e-shopom a potom sa uvidí. V štatistikách ešte len začínam.
monthly
Mám viac e-shopov a chcem mať ich štatistiky na jednom mieste. O štatistiky sa starám sám.
monthly
V štatistikách som ako ryba vo vode, mám viac e-shopov a team ľudí, ktorí tiež potrebujú prístupy.
monthly
Potrebujem riešenie na mieru - som výrobca e-shopov a chcem sledovať štatistiky všetkých vyrobených e-shopov.
we will contact you
