

See exactly what your shop earns you

Revenue, margins and ads in one place — and AI tells you what to do
No spreadsheets, no guessing. Open the report and instantly see what is growing, what costs money and where to push.
Register FREE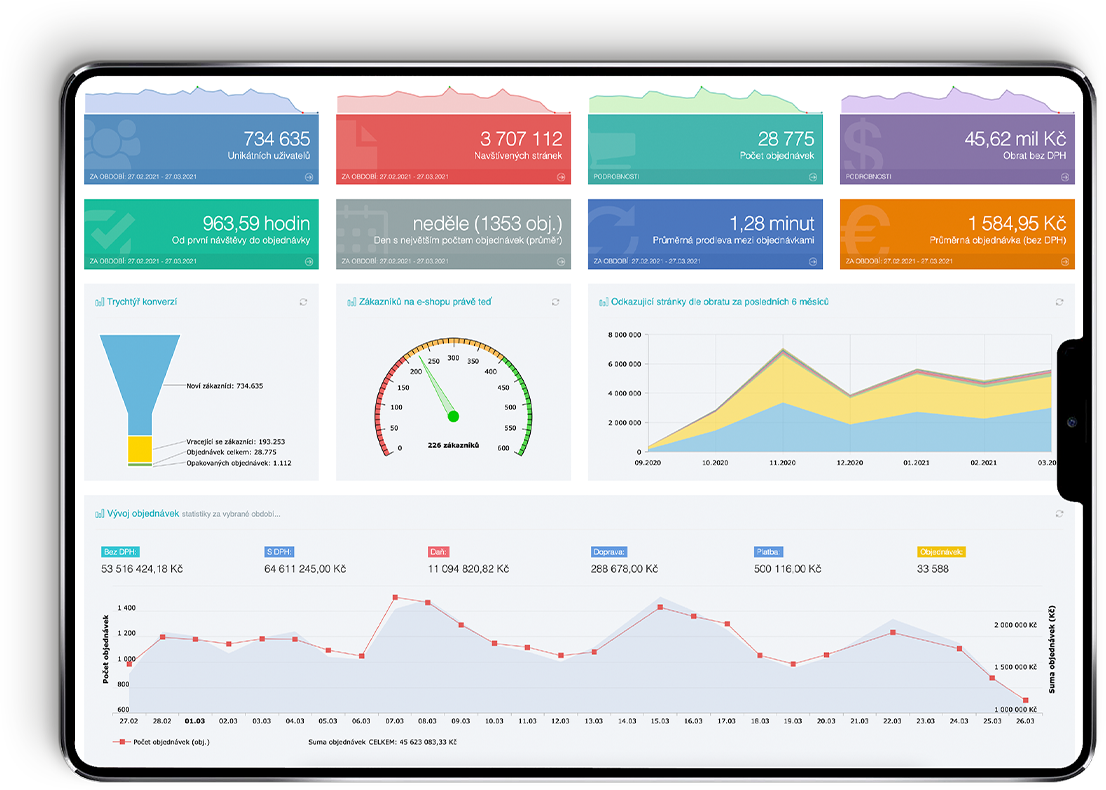
Selling to multiple countries?
We'll clearly compare shipping, payments and performance across countries
What works in Czechia is the opposite in Poland, and in Germany you should definitely use a different payment method than in Hungary.
Register FREE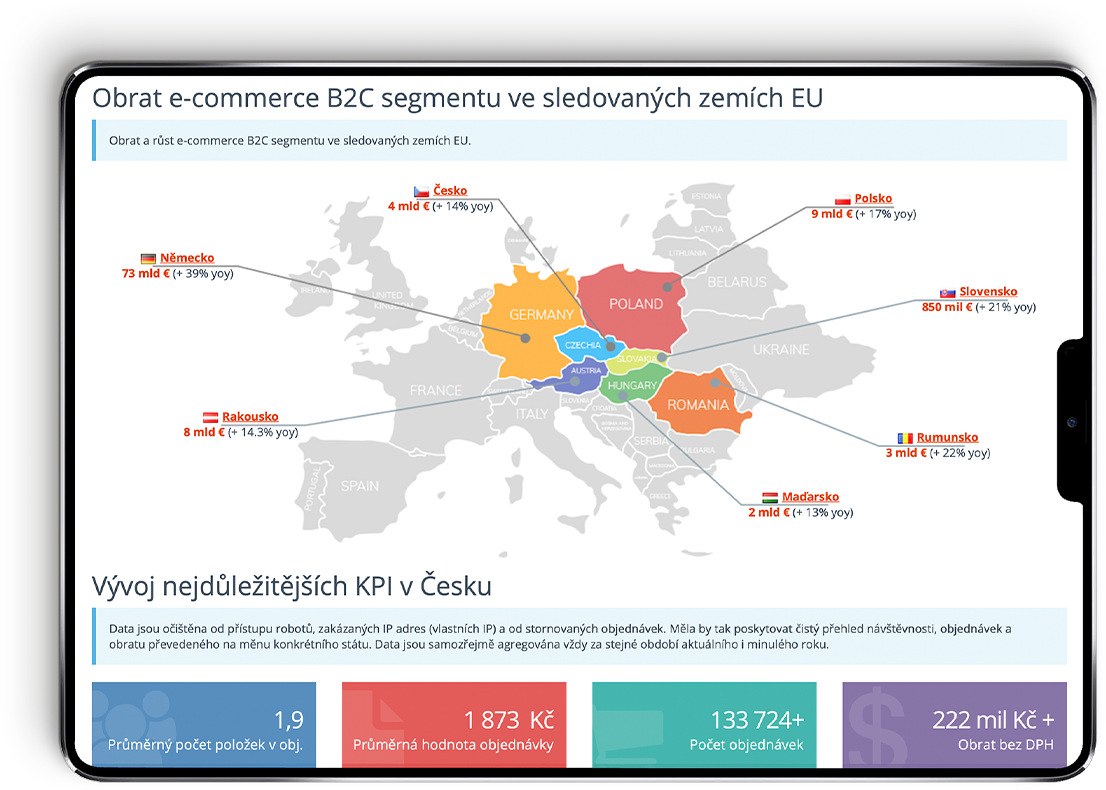
Data analysis of your e-shop
Make decisions based on accurate data
No more wasted budget on unnecessary marketing campaigns, no more out-of-stock low-margin products with high CPC.
Register FREE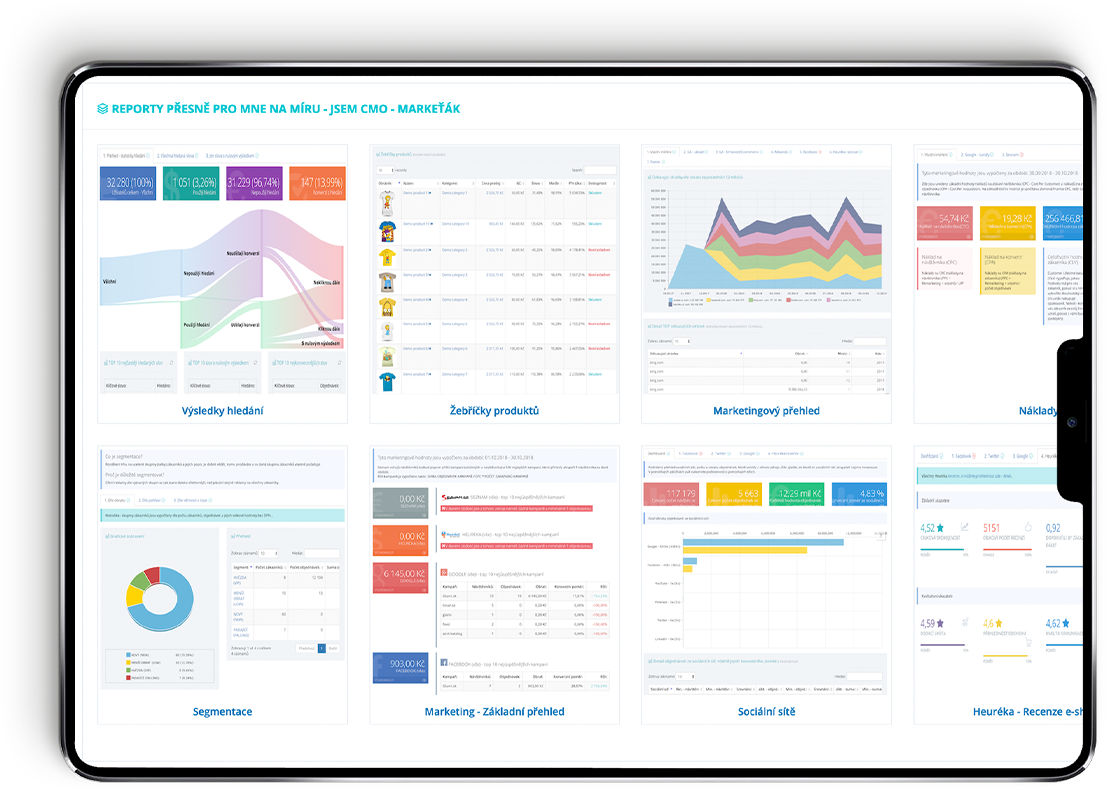
We help e-shops grow across industries
Why no customer logos or names here? Discretion is part of our contract. The fact that our reports help you grow stays between us — your competitors do not need to know.
About the service
AI that reads your data and tells you what to do
You do not need to be an analyst. AI goes through your numbers, finds opportunities and problems, and writes concrete steps — in plain words.
Explains what each chart means and what to do.
How much you will sell tomorrow and next month.
Ask anything about your data.
Alerts you automatically + daily summary.
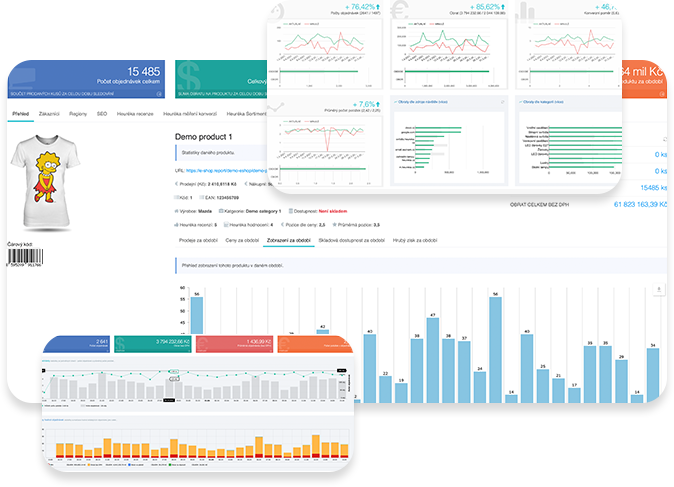

Product management – do you know your TOP products, categories, manufacturers?
ABC analysis, Lorenz curve, Pareto rule – 20% of products make 80% of your e-shop's revenue – do you know which products those are?
Instant rankings of TOP products, categories and brands by revenue and margin. ABC analysis reveals what really drives sales and what just sits in stock. The Purchasing Center tells you every morning what to reorder before bestsellers sell out — and where your dead capital lies.
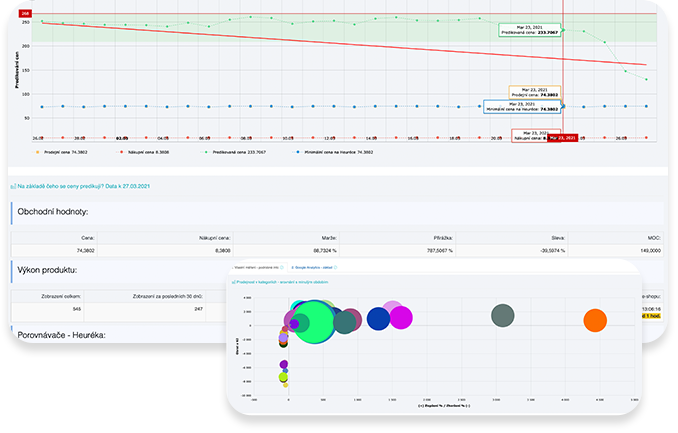

Automated pricing powered by deep machine learning
Using advanced artificial intelligence – deep machine learning – we recommend product price changes based on seasonality, stock, margin, comparison site position and many other factors.
We track competitor prices in Google Shopping — for each product you see the cheapest, average and most expensive offer on the market and your position among sellers. We watch your margins based on real purchase prices and advise where you have room to raise prices and where competitors undercut you.
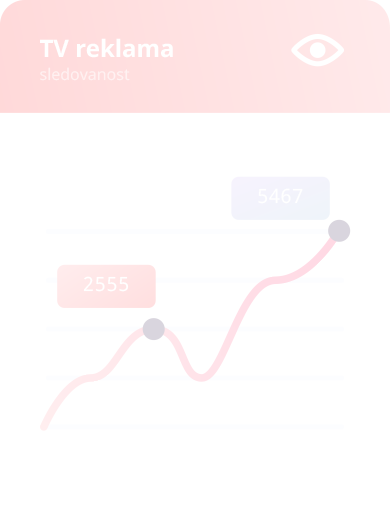
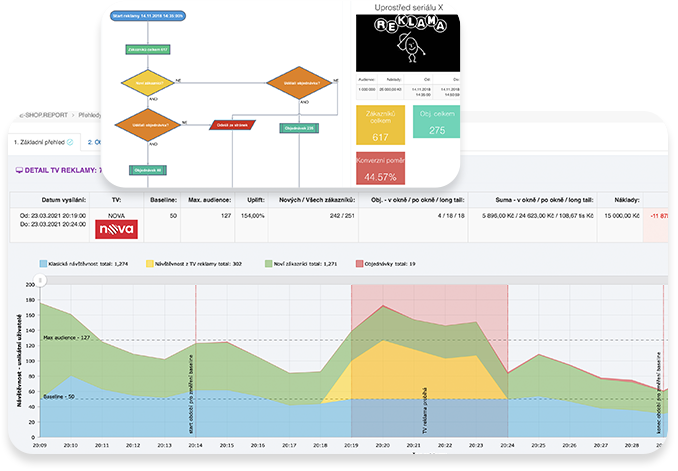

TV / Radio attribution – we show the impact of your TV or radio ad on your e-shop
Do you have TV or radio advertising and don't know what % of visitors came to your site because of it? We know.
We measure the impact of every aired spot on your e-shop traffic and orders — minute by minute we compare reality against the expected baseline. You will learn which stations, air times and creatives actually bring customers, and base your campaign budget on data instead of impressions.
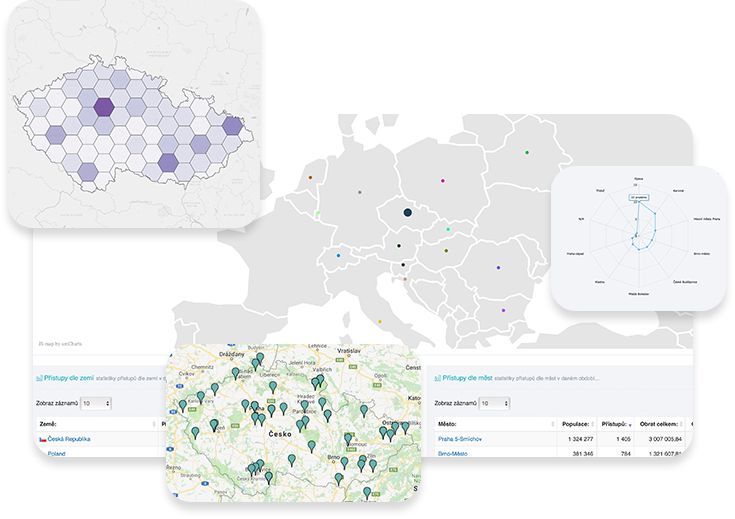

Geographic KPI – in which city is it worth opening a store?
Population in individual cities and their share of revenue, number of orders per city – where do you have the most customers and where do they stay?
You see orders and customers on a map by country and city — including a comparison with the size and growth rate of the local market. You will know where your brand is strong and where potential is untapped, whether you are planning a pickup point, a store or expansion abroad.
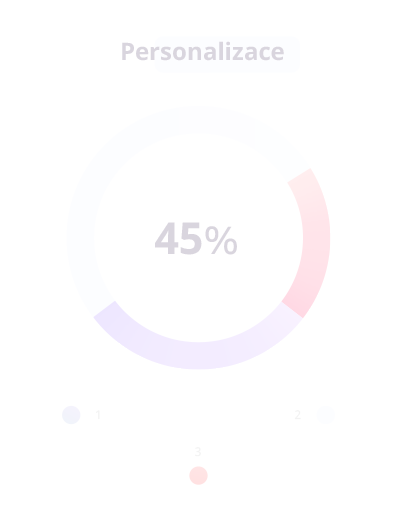
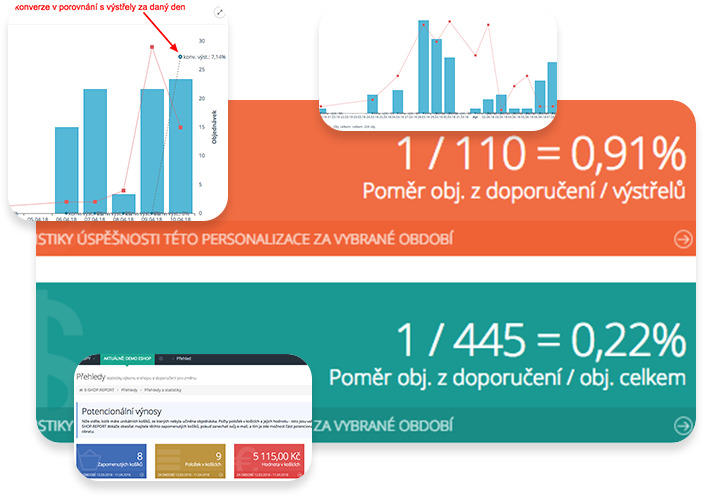

E-shop personalization – true 1:1 personalization with your customers
Thanks to advanced AI, we can display data for a specific customer and show them relevant products based on their behavior.
Show every visitor what really interests them — product recommendations tailored to their behavior and purchase history. Remind them of abandoned carts and turn anonymous visitors into returning customers.
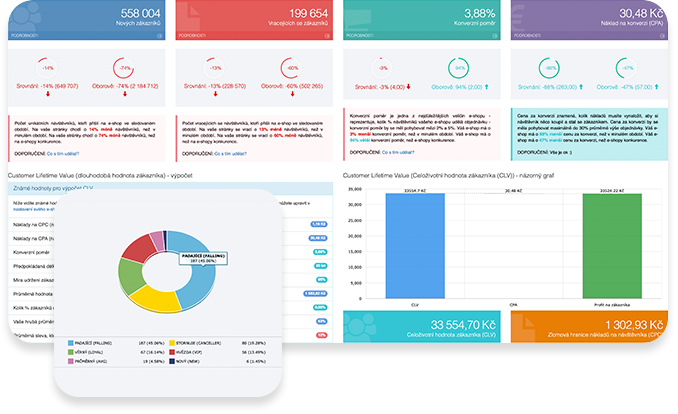

Advanced customer segmentation – who are your stars and loyal customers?
What is the Customer Lifetime Value (CLV)? And the average order? How many orders does a customer make on average per year?
We segment customers by value and behavior — stars, loyal ones, dormant and one-time buyers. For each segment you see spending, purchase frequency and lifetime value, so you know exactly who to send an offer to and who to save before they leave for a competitor.

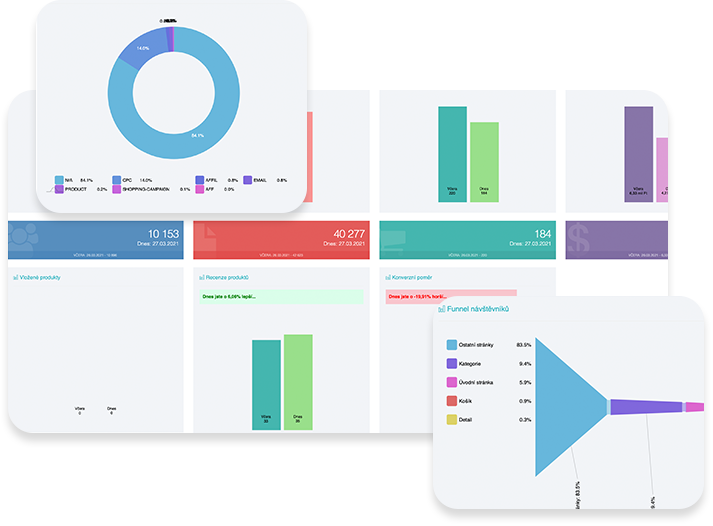

Real time – track data in real time – how much better or worse are you compared to yesterday?
Not just these important KPIs, but also traffic, conversion rate, number of orders, average order value and much more.
A live overview: how many people are on your site right now, what they are browsing and how much you have earned today — compared to yesterday at the same moment. You will instantly see the effect of a freshly launched campaign, a sale or a media mention.
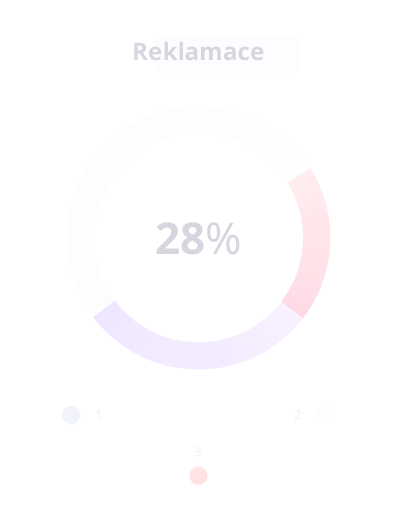
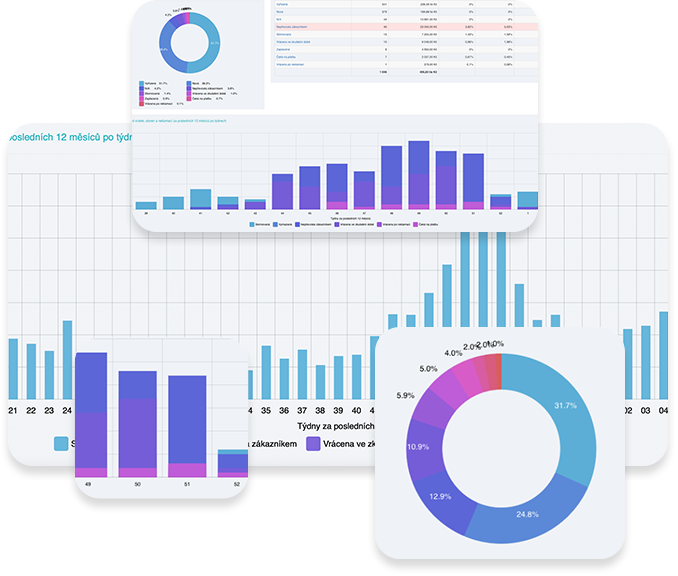

Returns & Complaints – do you know what % of products are returned and why?
In the complaints overview you can see their trend, reasons for complaints and specific products.
The trend of complaints and returns over time, the most common reasons and the specific products returned most often. You will spot problematic goods before they ruin your reviews — and see how much money returns really cost you.

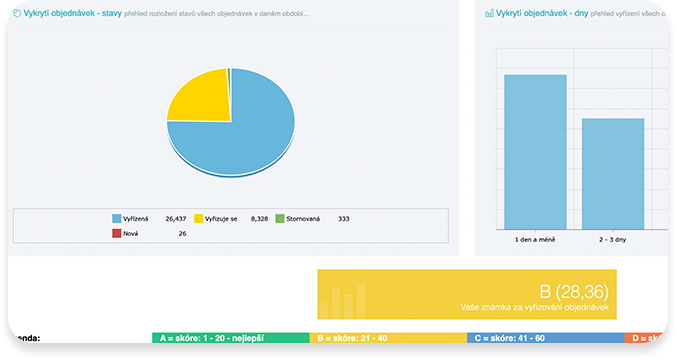

Order fulfillment – how long does it actually take to ship an order to a customer?
Does your logistics work the way you imagine?
See how fast you process orders and where they get stuck — including how much money is currently hanging in unpaid orders and cash-on-delivery. We track the aging of unpaid payments, how fast customers pay, and the payment methods where orders die most often. A breakdown of processing time shows how much is spent by the customer paying and how much by you shipping.
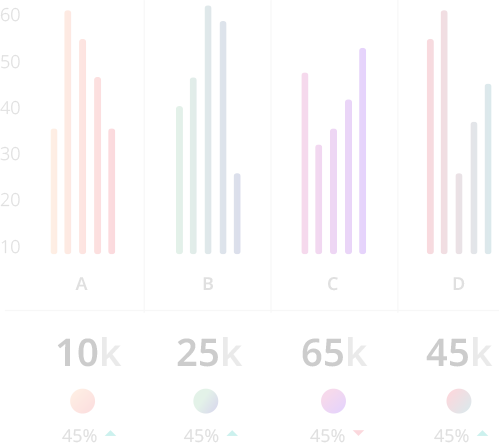
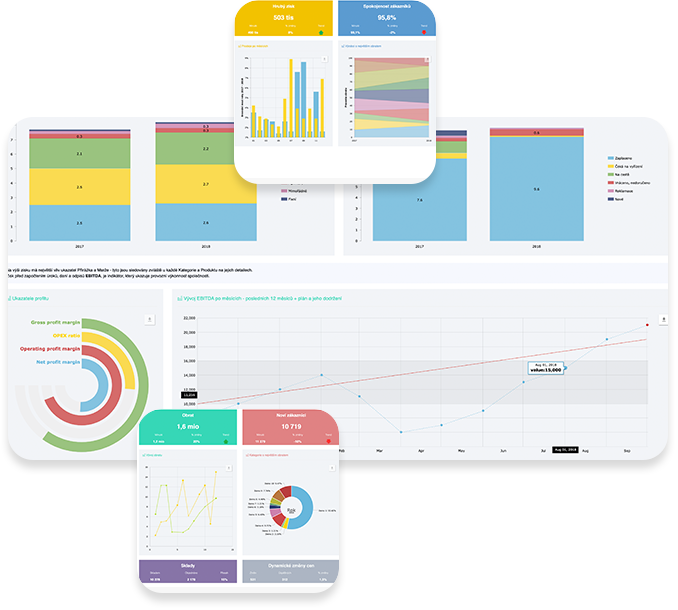

Financial indicators – clear display of revenues and costs
We'll display your financial data – clearly and comprehensibly in one place. Not just for CFOs.
Revenue, gross profit and margins from real purchase prices — no estimates. Advertising costs against actual results (ad-spend ratio, ROAS), monthly closings and goal tracking with the pace of where you should be. Clear for both the owner and the CFO.

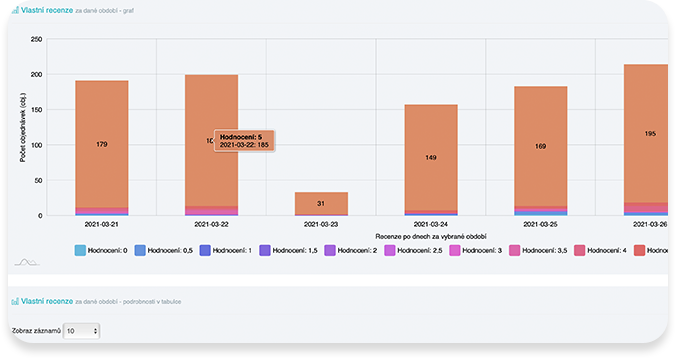

Customer reviews – have all ratings in one place, connected with other data
We connect ratings with a specific customer, specific order and product.
Ratings from Heureka and other sources in one place — average score, recommendation share and development over time, linked to specific products. We alert you to new negative reviews so you can react before they discourage more customers.
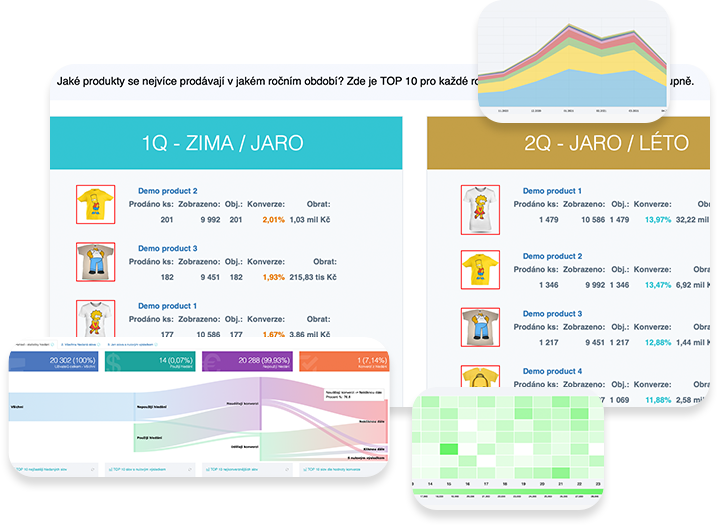

Custom metrics – we are innovators in various perspectives on e-shop performance
Do you know which products sell during different periods, promotions and discount coupons?
AI sales predictions for tomorrow and next month, a What-If simulator (what a change in margin or ad budget does to your profit) and smart alerts when something happens. Plus metrics you will not find elsewhere — from goal pace to warehouse health.

























Connect additional data from various sources
We'll connect our system to other services so you have a complete picture in one place. Not just your ERP, but any source with an API.
Video Academy
Meet E-SHOP.REPORT in under a minute
A short video introduction — what E-SHOP.REPORT measures, watches and reports for you every day.
E-SHOP.REPORT is a tool for measuring your e-shop, measuring the profitability of your products and tracking important KPIs.
Trends & Analytics
Trends and analytics of e-commerce in Europe
We collect and aggregate data from 300+ e-shops selling across the whole of Europe.
Data is always up to date as of the previous day.

Data collection
Custom measurement tools on connected e-shop websites deliver various raw data to our database.

Analysis
Mathematical algorithms and analyses are applied to all delivered data to extract meaningful insights.

Aggregation
The final step is data aggregation across all countries and connected e-shops.
B2C e-commerce revenue in monitored countries
Revenue and growth of B2C e-commerce in monitored countries.
| Country | Market size | Growth |
|---|---|---|
 Ukraine Ukraine | 5.3 bn € | ▲ +25 % |
 Romania Romania | 12 bn € | ▲ +18 % |
 Bulgaria Bulgaria | 2.5 bn € | ▲ +18 % |
 Moldova Moldova | 464 mn € | ▲ +15 % |
 Serbia Serbia | 846 mn € | ▲ +12 % |
 Albania Albania | 540 mn € | ▲ +12 % |
 North Macedonia North Macedonia | 350 mn € | ▲ +12 % |
 Montenegro Montenegro | 150 mn € | ▲ +12 % |
 Bosnia and Herzegovina Bosnia and Herzegovina | 420 mn € | ▲ +10 % |
 Spain Spain | 68 bn € | ▲ +9 % |
 Italy Italy | 59 bn € | ▲ +9 % |
 Portugal Portugal | 4.1 bn € | ▲ +9 % |
 Greece Greece | 3.1 bn € | ▲ +9 % |
 Croatia Croatia | 1.2 bn € | ▲ +9 % |
 Slovenia Slovenia | 860 mn € | ▲ +9 % |
 Poland Poland | 43 bn € | ▲ +8 % |
 Hungary Hungary | 4.8 bn € | ▲ +8 % |
 Slovakia Slovakia | 1.8 bn € | ▲ +8 % |
 Sweden Sweden | 13 bn € | ▲ +7 % |
 Norway Norway | 12 bn € | ▲ +7 % |
 Denmark Denmark | 7.8 bn € | ▲ +7 % |
 Finland Finland | 6.2 bn € | ▲ +7 % |
 Lithuania Lithuania | 1.2 bn € | ▲ +7 % |
 Estonia Estonia | 800 mn € | ▲ +7 % |
 Latvia Latvia | 700 mn € | ▲ +7 % |
 Iceland Iceland | 700 mn € | ▲ +7 % |
 France France | 112 bn € | ▲ +6 % |
 Germany Germany | 94 bn € | ▲ +6 % |
 Netherlands Netherlands | 36 bn € | ▲ +6 % |
 Belgium Belgium | 17 bn € | ▲ +6 % |
 Austria Austria | 11 bn € | ▲ +6 % |
 Ireland Ireland | 6.7 bn € | ▲ +6 % |
 Czechia Czechia | 7.7 bn € | ▲ +5 % |
 Switzerland Switzerland | 16 bn € | ▲ +3.5 % |
 United Kingdom United Kingdom | 150 bn € | ▲ +3.4 % |
Sources: national e-commerce associations and EuroCommerce · 2024
Complete pan-European data is for 2024; the full 2025 report is due in September 2026.
- Ukraine (+25%), Romania & Bulgaria (+18%) are the fastest-growing markets — Eastern Europe is where momentum is strongest right now.
- UK (€150bn), Germany (€93.6bn), France (€112bn) are huge but growing at just 3–6%; competition is fierce and customer acquisition costs are high.
- Spain & Italy (both +9%) offer a sweet spot — large markets with above-average growth, worth serious attention.
- Practical move: Prioritise Eastern/Southern Europe for expansion if you want growth headroom; enter Western Europe only with a clear differentiation strategy and deep pockets.
The European opportunity map
Each market is a bubble: growth across, market size up, bubble area = how many people shop online. Top-right are the stars (big and fast), top-left the rising opportunities.
Bubble size = people shopping online · dashed lines = European median growth and size · click a market type in the legend to show or hide it.


5
language versions

399
orders per second

300+
active e-shops

1 636.93
% conversion rate
Who will use our tool?

Agencies
Get data for your clients and track how their projects are developing. All within one plan that you can share with your colleagues.

Freelancers
Unlike agencies, you don't need to collaborate with multiple colleagues, but you still need your clients' data in one place.

E-shop owners
If you need data for one website or e-shop, you don't need to pay unnecessarily for multiple tools. We provide the necessary foundation.
CEO – I'm the owner
- How are we doing
- Year-on-year comparison
- Management overview
- Order overview
- How are orders fulfilled?
CMO – I'm the marketer
- Return on investment
- Campaign performance
- TV advertising evaluation
- Social media
- Channel evaluation
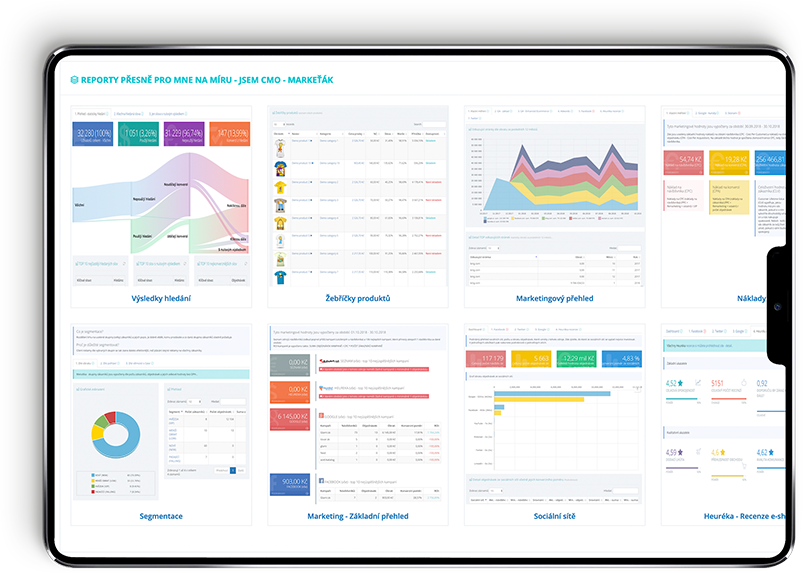
- Results (ROAS / ad spend)
CSO – I'm the sales person
- Sales overview
- Product overview
- ABC analysis TOP
- Customer CLV
- Customer segmentation
CFO – I love finance
- Revenue vs. Costs
- E-commerce overview
- Goal achievement
- Customer CLV
- Return on investment
Pricing
Pricing

Starter
I just want to try it with one e-shop and see how it goes. I'm just starting with statistics.
- Start dashboard with daily KPIs and tasks
- E-commerce overview, traffic, geolocation
- Top products, categories and brands
- Satisfaction (Heureka, Zbozi.cz)
- Search visibility (Search Console)
- Site speed (PageSpeed / Lighthouse)
- AI chart insights and daily summary
- E-mail reports, TV output
- E-mail support

Advanced
I have multiple e-shops and want to have their statistics in one place. I manage the statistics myself.
- Everything in ZACINAM
- AI chat assistant — ask your data in plain language
- Loyalty, segmentation and customer detail
- ABC analyses (products, categories, brands, customers)
- Marketing hub: channels, UTM, campaigns
- Results: PNO / PNM / ROAS and goals
- Marketing integrations and spend: GA4, Google Ads, Meta, Sklik
- Inventory and Purchasing center: what to reorder, AI brief, suppliers, seasonality
- Abandoned carts, complaints and returns
- Smart alerts, data export · up to 3 e-shops

Expert
I'm like a fish in water with statistics, I have multiple e-shops and a team of people who also need access.
- Everything in POKROCILY
- AI forecast, What-If and Command Center
- Attribution and conversion paths — 6 models over real orders
- Market vs. you: 35-country benchmark and expansion opportunities
- Market demand and seasonality (Google)
- Search positions – rank tracker (Google)
- Cloudflare and technical SEO
- Competitor benchmark, feed health (GMC)
- TV/radio attribution and dynamic pricing
- Weekly and monthly AI report
- API access · priority support and phone · up to 10 e-shops

Custom
A tailored solution for agencies and large operations — unlimited e-shops, ERP connection and custom integrations.
- Everything in EXPERT
- Unlimited e-shops
- Unlimited users
- No traffic limit
- ERP and XML feed integration
- Custom integrations
- Dedicated support and SLA
- Personal onboarding
Prices exclude VAT — VAT is added by your country in the secure Stripe checkout. 14 days free, cancel anytime.
| Starter | Advanced | Expert | Custom | |
|---|---|---|---|---|
| Price from (monthly) | 99 € | 249 € | 549 € | By arrangement |
| Number of e-shops | 1 | 3 | 10 | unlimited |
| Number of users | 1 | 1 | 3 | unlimited |
| Monthly visitors | 100 000 | 600 000 | 2 000 000 | unlimited |
| Features | ||||
| Start dashboard with daily KPIs and tasks | ✓ | ✓ | ✓ | ✓ |
| E-commerce overview, traffic, geolocation | ✓ | ✓ | ✓ | ✓ |
| Top products, categories and brands | ✓ | ✓ | ✓ | ✓ |
| Satisfaction (Heureka, Zbozi.cz) | ✓ | ✓ | ✓ | ✓ |
| Search visibility (Search Console) | ✓ | ✓ | ✓ | ✓ |
| Site speed (PageSpeed / Lighthouse) | ✓ | ✓ | ✓ | ✓ |
| AI chart insights and daily summary | ✓ | ✓ | ✓ | ✓ |
| E-mail reports, TV output | ✓ | ✓ | ✓ | ✓ |
| E-mail support | ✓ | ✓ | ✓ | ✓ |
| AI chat assistant — ask your data in plain language | — | ✓ | ✓ | ✓ |
| Loyalty, segmentation and customer detail | — | ✓ | ✓ | ✓ |
| ABC analyses (products, categories, brands, customers) | — | ✓ | ✓ | ✓ |
| Marketing hub: channels, UTM, campaigns | — | ✓ | ✓ | ✓ |
| Results: PNO / PNM / ROAS and goals | — | ✓ | ✓ | ✓ |
| Marketing integrations and spend: GA4, Google Ads, Meta, Sklik | — | ✓ | ✓ | ✓ |
| Inventory and Purchasing center: what to reorder, AI brief, suppliers, seasonality | — | ✓ | ✓ | ✓ |
| Abandoned carts, complaints and returns | — | ✓ | ✓ | ✓ |
| Smart alerts, data export · up to 3 e-shops | — | ✓ | ✓ | ✓ |
| AI forecast, What-If and Command Center | — | — | ✓ | ✓ |
| Attribution and conversion paths — 6 models over real orders | — | — | ✓ | ✓ |
| Market vs. you: 35-country benchmark and expansion opportunities | — | — | ✓ | ✓ |
| Market demand and seasonality (Google) | — | — | ✓ | ✓ |
| Search positions – rank tracker (Google) | — | — | ✓ | ✓ |
| Cloudflare and technical SEO | — | — | ✓ | ✓ |
| Competitor benchmark, feed health (GMC) | — | — | ✓ | ✓ |
| TV/radio attribution and dynamic pricing | — | — | ✓ | ✓ |
| Weekly and monthly AI report | — | — | ✓ | ✓ |
| API access · priority support and phone · up to 10 e-shops | — | — | ✓ | ✓ |
| Unlimited e-shops | — | — | — | ✓ |
| Unlimited users | — | — | — | ✓ |
| No traffic limit | — | — | — | ✓ |
| ERP and XML feed integration | — | — | — | ✓ |
| Custom integrations | — | — | — | ✓ |
| Dedicated support and SLA | — | — | — | ✓ |
| Personal onboarding | — | — | — | ✓ |
Each higher plan always includes everything from the lower one.
We'll shine a light on every corner of your e-shop
We'll find the weak spots and recommend changes